Find checkout losses before spending more on ads
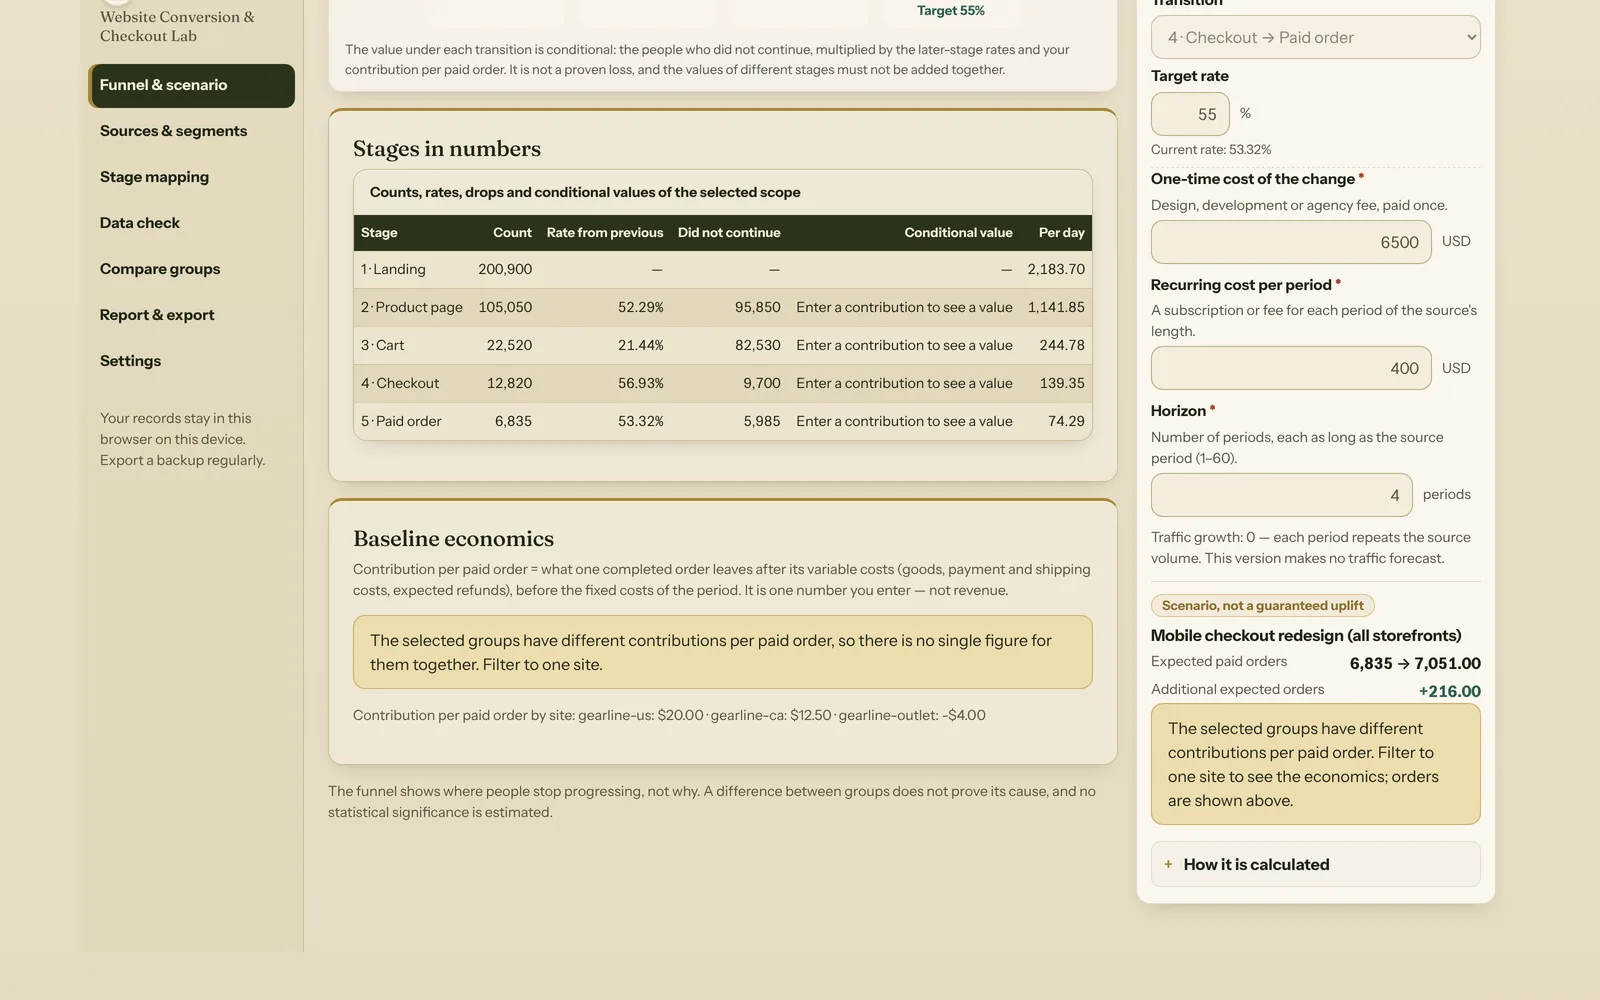
More traffic can send more people into the same broken purchase journey. Before increasing a campaign budget, establish where visitors stop progressing and whether an improvement would pay for itself after the costs you really carry. In the example below, raising one checkout step from 50% to 60% is worth $1,000 per period after its own running cost — and the most you could spend once on that fix and still get it back within three periods is $3,000.
Start with a consistent funnel
A purchase funnel is only meaningful when every stage counts the same kind of thing for the same people. Sessions that reach a product page, add an item, begin checkout and pay must belong to the same defined population and observation window. That is what makes it a closed funnel: each stage counts only those who reached the previous one.
Three definitions decide whether your numbers can be compared at all:
- Counting unit — sessions, users or orders. Never mix them, and never use raw event counts: one visitor can trigger "view item" ten times.
- Cohort — who is counted at the first stage, over which dates and in which time zone.
- Attribution window — how long after the first stage a later step still counts.
A count of product events is not directly comparable to a count of unique buyers. If a later stage is larger than an earlier stage — 23,800 product views after 10,000 sessions, for example — the data are not a closed funnel. Investigate the definitions before calculating any rate; do not "fix" the numbers by hand.
Two more rules prevent silent mistakes. A rate over a stage with zero people is not defined, not 0%. And a missing count is unknown, not zero.
Read the funnel stage by stage
Imagine a shop with 10,000 starting sessions in October, 5,000 product views, 1,000 carts, 600 checkouts and 300 paid orders.
| Stage | Count | Rate from previous | Did not continue |
|---|---|---|---|
| Landing | 10,000 | — | — |
| Product page | 5,000 | 50% | 5,000 |
| Cart | 1,000 | 20% | 4,000 |
| Checkout | 600 | 60% | 400 |
| Paid order | 300 | 50% | 300 |
Total conversion is 300 ÷ 10,000 = 3%. The biggest absolute drop is from product page to cart, but the step that touches buyers who have already decided is the last one: only half of the people who start checkout pay.
It is tempting to multiply every drop by the order value and call it "lost revenue". Do not. A person who left at the product page would still have had to pass the cart and checkout stages. If you want a value per transition, multiply the drop by the later-stage rates and by your contribution per order — and treat it as conditional, never as proven lost profit, and never add the values of different stages together.
Keep devices and sites visible
A combined total can hide a mobile checkout problem or make a source look weak because it brings a different audience. In our example the 10,000 sessions are two separate groups:
- Mobile: 6,000 → 2,700 → 500 → 250 → 100 paid (1.67%)
- Desktop: 4,000 → 2,300 → 500 → 350 → 200 paid (5%)
Mobile checkout completes at 40%, desktop at 57%. Compare the groups — but do not treat the difference as proof that a particular page element caused it. Phones and computers bring different people with different intentions.
Groups may be added up only when they do not overlap (each session belongs to exactly one group) and share one cohort, counting unit and period. If you compare a 31-day month with a 28-day month, compare per day, not totals.
Translate a scenario into contribution
The final transition converts 50% of checkouts. Raising that transition to 60%, with everything else unchanged, produces:
10,000 × 0.5 × 0.2 × 0.6 × 0.6 = 360 expected orders — 60 more than the baseline.
Now use money that reflects your real economics. The right number is not revenue but contribution per paid order: what one completed order leaves after goods, payment fees, shipping and expected refunds, before the fixed costs of the period. Say each order contributes $20.
| Step | Calculation | Result |
|---|---|---|
| Change in contribution | 60 × $20 | $1,200 per period |
| Net per period | $1,200 − $200 recurring | $1,000 |
| Net over 3 periods | 3 × $1,000 − $1,800 one-time | $1,200 |
| Simple payback | $1,800 ÷ $1,000 | 1.8 periods |
| Maximum one-time budget | 3 × $1,000 | $3,000 |
With $200 of recurring expense and a $1,800 implementation bill, the scenario leaves $1,000 per period and has a simple payback of 1.8 periods. These numbers are conditional on the target actually being achieved. A target is your assumption, not a forecast.
Apply the same 60% target to the mobile group alone and the answer changes, because it starts from mobile's own rates: 100 → 150 expected orders, +50, so $1,000 of contribution, $800 net per period and a payback of 2.25 periods. Never reuse the total's result for a segment.
Do not add overlapping opportunities
Suppose you also believe the cart step could improve from 60% to 70%. On its own it adds 50 orders; the checkout fix on its own adds 60. Together they do not add 110 — they add 120:
10,000 × 0.5 × 0.2 × 0.7 × 0.6 = 420 expected orders.
Improving an earlier stage changes how many people reach the later stages, so the combined scenario must be recalculated over the full sequence. Adding separate opportunities gives the wrong answer — sometimes too high, sometimes too low. The same logic is why a list of "lost profit per stage" must never be totalled.
When more orders mean less profit
Contribution can be negative. A clearance outlet that sells below its variable cost after shipping and returns loses money on every completed order. If the same +60 orders each contribute −$20, the change is −$1,200 per period, −$1,400 after the $200 running cost, and the fix is never paid back. A conversion project is only worth doing where the extra orders earn something.
One shop or many
An independent shop may need only a few totals. A medium-sized seller may need separate cohorts for devices, sources, countries and sites, a different contribution per site and an export of exactly the scope being reviewed. In both cases, the definitions matter more than the number of charts.
A checklist before you raise the ad budget
- Write down the counting unit, cohort, period and attribution window of your funnel.
- Check that no stage is larger than the one before it.
- Look at devices, sites and sources separately; sum them only when they cannot overlap.
- Enter your contribution per paid order, not your average order value.
- Set an explicit target for the step you plan to fix and price the change: one-time cost, running cost and horizon.
- Recalculate several fixes together instead of adding them up.
- Treat the result as a scenario, not a guaranteed uplift — and test the change before you scale traffic.
Do the calculation with your own numbers
Website Conversion & Checkout Lab combines stage counts with the contribution and intervention cost you enter. It imports aggregated exports with explicit column mapping, blocks open funnels and incompatible groups, and shows every calculation step. Inspect the fixed demo to follow the numbers from sessions to payback — no AI guesses, exact arithmetic.
For a different question — whether advertising creates additional profit rather than receiving credit for sales that would have happened anyway — use Advertising Profit & Experiment Lab.
Tools mentioned in this guide
 Interactive tool
Website Conversion & Checkout Lab
See where a purchase funnel loses customers and calculate what an improvement would be worth after your real variable costs.