
Are my ads profitable? ROAS vs real profit
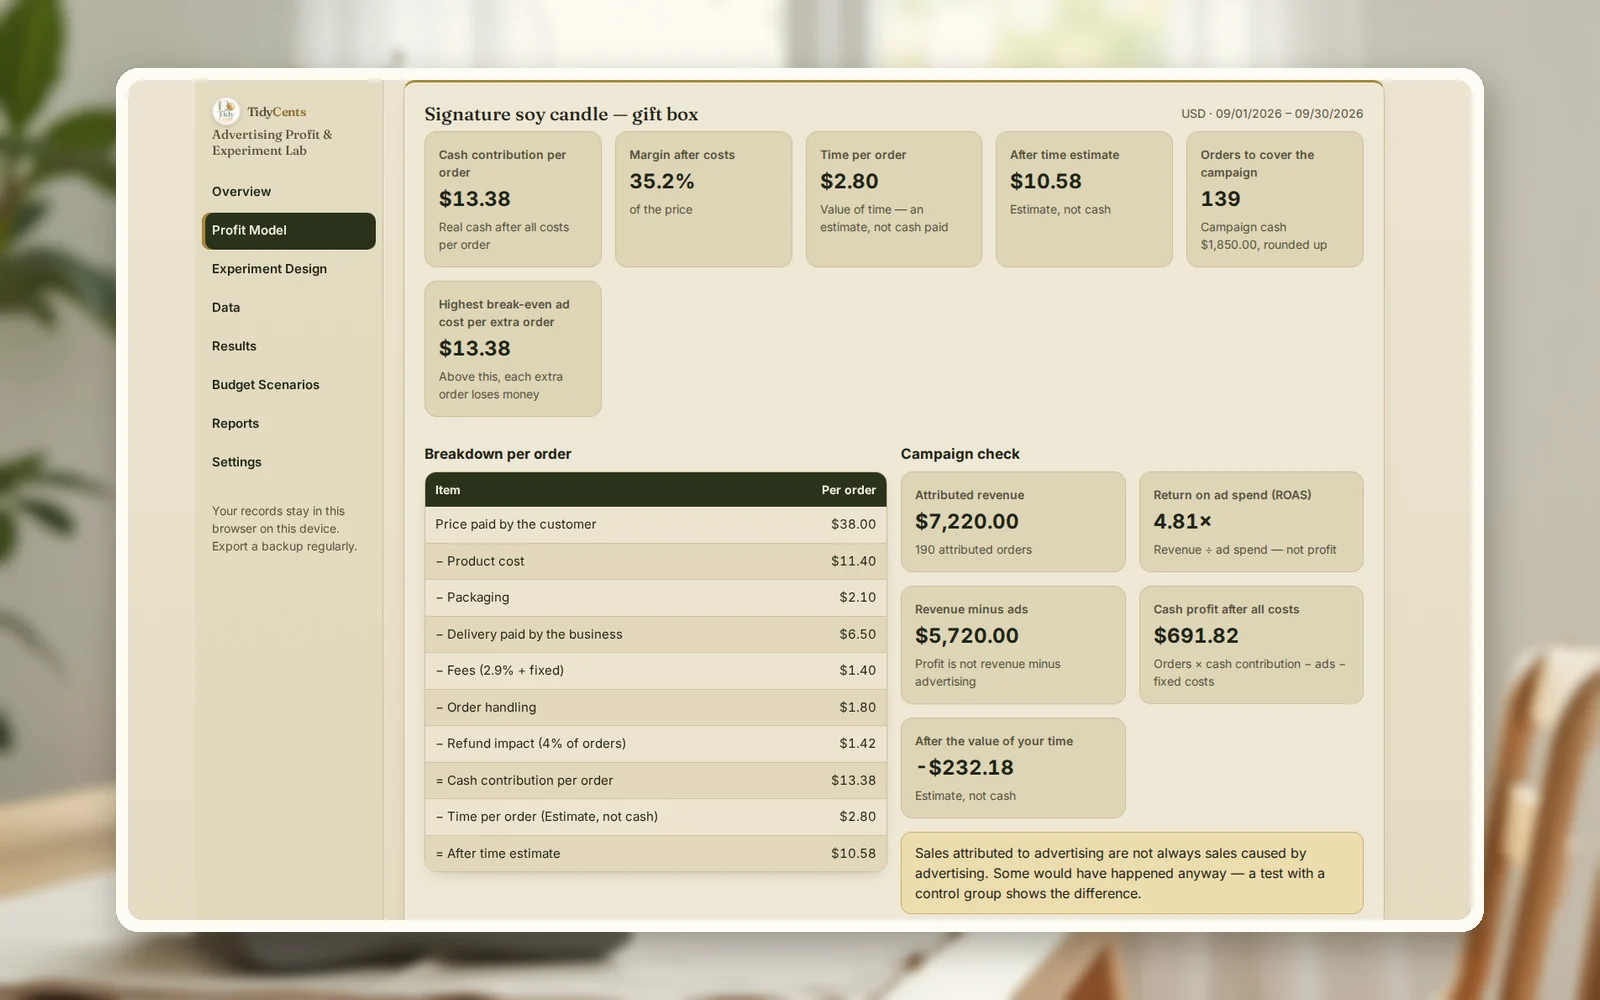
Your ads are profitable only if the orders they add — not the orders they are credited with — times the profit per order is larger than what the campaign costs. ROAS (revenue ÷ ad spend) answers neither part: it uses revenue instead of profit, and it counts orders that might have happened anyway. In the example below, a campaign with a 4.81 ROAS leaves $691.82 of cash at best, and −$232.18 once the owner's time is counted.
The fix is two numbers and one test: profit per order, the most you can pay for one order, and a holdout group that shows what the ads really add.
Why ROAS misleads
ROAS looks like a profit measure, but it is a revenue ratio. Three things sit between it and real profit:
- Margin. A $38 order that costs $23.20 to make, pack, ship and process leaves far less than $38.
- Refunds and fees. Returned orders, payment fees and return shipping come out of every sale.
- Attribution. Ad platforms credit themselves with orders from people who saw an ad — including people who were going to buy anyway.
A campaign can therefore show a "good" ROAS and still lose money, or show a modest one and be the most useful thing you spend on.
The formula
- Contribution per order = price − product cost − packaging − shipping − payment fees − handling − expected refund cost.
- Allowable cost per order = contribution per order. Pay more than this to win an order and that order loses money.
- Break-even orders = (ad spend + campaign fixed costs) ÷ contribution per order.
- Campaign profit = orders × contribution − ad spend − fixed costs.
- Incremental profit = (contribution per person in the ad group − contribution per person in the holdout group) × people in the ad group − extra ad spend and costs.
A worked example
The numbers are the demo of the Advertising Profit & Experiment Lab: a fictional candle shop selling a gift box at $38.
Step 1 — profit per order. Product $11.40, packaging $2.10, shipping $6.50, handling $1.80 and payment fees of $1.40 make $23.20 of variable cost. Refunds (4% of orders, partly recovered, plus return shipping) cost about $1.42 per order. That leaves $13.38 per order — a 35.2% margin. So the most the shop can pay to win one order is $13.38.
Step 2 — the platform's view. In September the shop spent $1,500 on ads plus $350 of fixed campaign costs. The ad platform reported 190 orders and $7,220 of revenue: a ROAS of 4.81. Subtracting spend from revenue suggests $5,720 of "profit".
| Platform view | Real cash view | |
|---|---|---|
| Orders | 190 attributed | 190 at most |
| Value per order | $38.00 revenue | $13.38 contribution |
| Campaign cost | $1,500 | $1,850 |
| Result | $5,720 | $691.82 |
| After owner's time | — | −$232.18 |
Even if every one of the 190 orders was caused by the ads, the campaign made $691.82 — and it needed 139 orders just to break even. Counting the 14 hours of campaign work and 6 minutes per order at $28 an hour, it lost money.
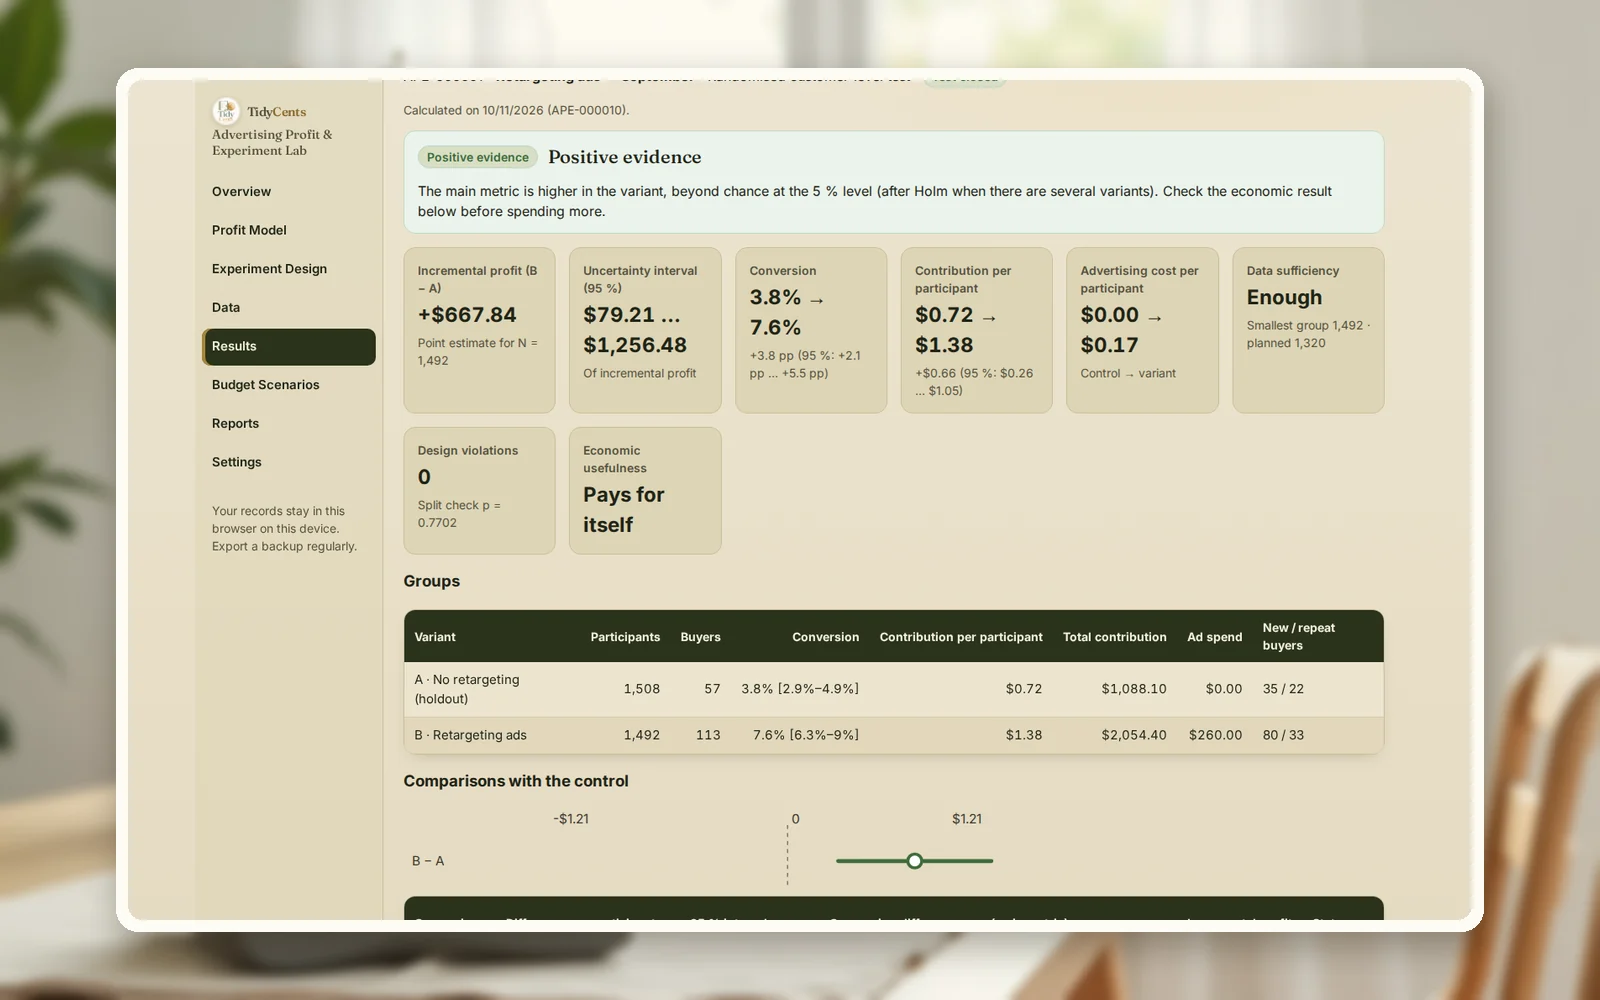
Step 3 — what the ads really add. The shop then ran two tests with a holdout group that saw no ads:
- Retargeting (1,492 visitors shown ads, 1,508 held out): conversion rose from 3.78% to 7.57%. Incremental profit: $667.84, with a 95% range of $79.21 to $1,256.48. Status: useful.
- Local radio (six region-weeks with spots, six without): orders rose by a statistically clear margin, but the extra contribution did not cover $1,800 of airtime and $400 of production. Incremental profit: −$1,193.45, range −$2,041.85 to −$345.06. Status: harmful — a real lift that still loses money.
Step by step: check if your ads pay
- Calculate contribution per order from your own costs, including fees and refunds.
- Set your allowable cost per order — the contribution. Any ad that costs more per order loses money on that order.
- Compute break-even orders for the campaign, including fixed costs and your time if it matters.
- Compare with attributed orders — as an upper bound, not as proof.
- Run a holdout test: keep a random group (people, regions or weeks) without ads, and compare contribution per person.
- Read the range, not just the average. If the range includes zero, the result is uncertain.
- Scale only what shows positive incremental profit, and re-test after big changes.
Common mistakes
- Using ROAS as profit. Revenue is not what you keep.
- Counting attributed orders as caused orders. Some would have happened anyway.
- Ignoring refunds and fees. They are part of every order's cost.
- Comparing buyers only. A test must include people who did not buy, or the result is biased.
- Declaring a winner too early. Small samples swing; check the planned sample size first.
- Calling a lift a success. More orders can still mean less profit, as the radio test shows.
When a tool helps
The profit-per-order maths fits on a calculator. Designing a fair test, importing participants including non-buyers, checking the split, computing a confidence range and translating it into profit does not. The Advertising Profit & Experiment Lab does all of it with visible formulas and honest statuses — useful, harmful, inconclusive, insufficient — instead of a single green number. Exact decimal arithmetic, no AI guesses. For a single break-even check, the free break-even calculator is enough.
Open the demo with the candle shop above — every screen, no sign-up — then enter your own offer and campaign.
Open the Advertising Profit & Experiment LabAll cost, pricing and profit tools
Related guides: is a win-back offer worth it, the real profit per marketplace order and how to follow up on a quote.
FAQ
What is a good ROAS?
There is no universal number. Your break-even ROAS is price ÷ contribution per order — here $38 ÷ $13.38, about 2.84 — and that is before fixed costs and before asking how many orders the ads really caused. Compare against your own break-even, not a benchmark.
What is a holdout test?
You randomly keep part of your audience — people, regions or weeks — away from the ads, and compare what both groups buy. The difference is what the ads added. It is the most direct way to separate caused orders from credited ones.
How big does a test need to be?
Big enough to detect the smallest effect that would change your decision. Plan the sample size before you start; small tests often end "inconclusive", which is an honest result, not a failure.
Should I count my own time?
If the campaign takes hours you would otherwise spend on paid work or sales, yes. Here, counting it turns a $691.82 gain into a $232.18 loss.
What if the result is inconclusive?
Then you do not know yet. Keep spending small, extend the test, or test a bigger difference. Scaling an inconclusive campaign is a bet, not a decision.
This is decision support, not financial or marketing advice.
Tools mentioned in this guide
 Interactive tool
Advertising Profit & Experiment Lab
Check whether a campaign adds profit, with costs, refunds and experiment uncertainty shown beside the result.

