
Is a win-back discount worth it? Count the profit
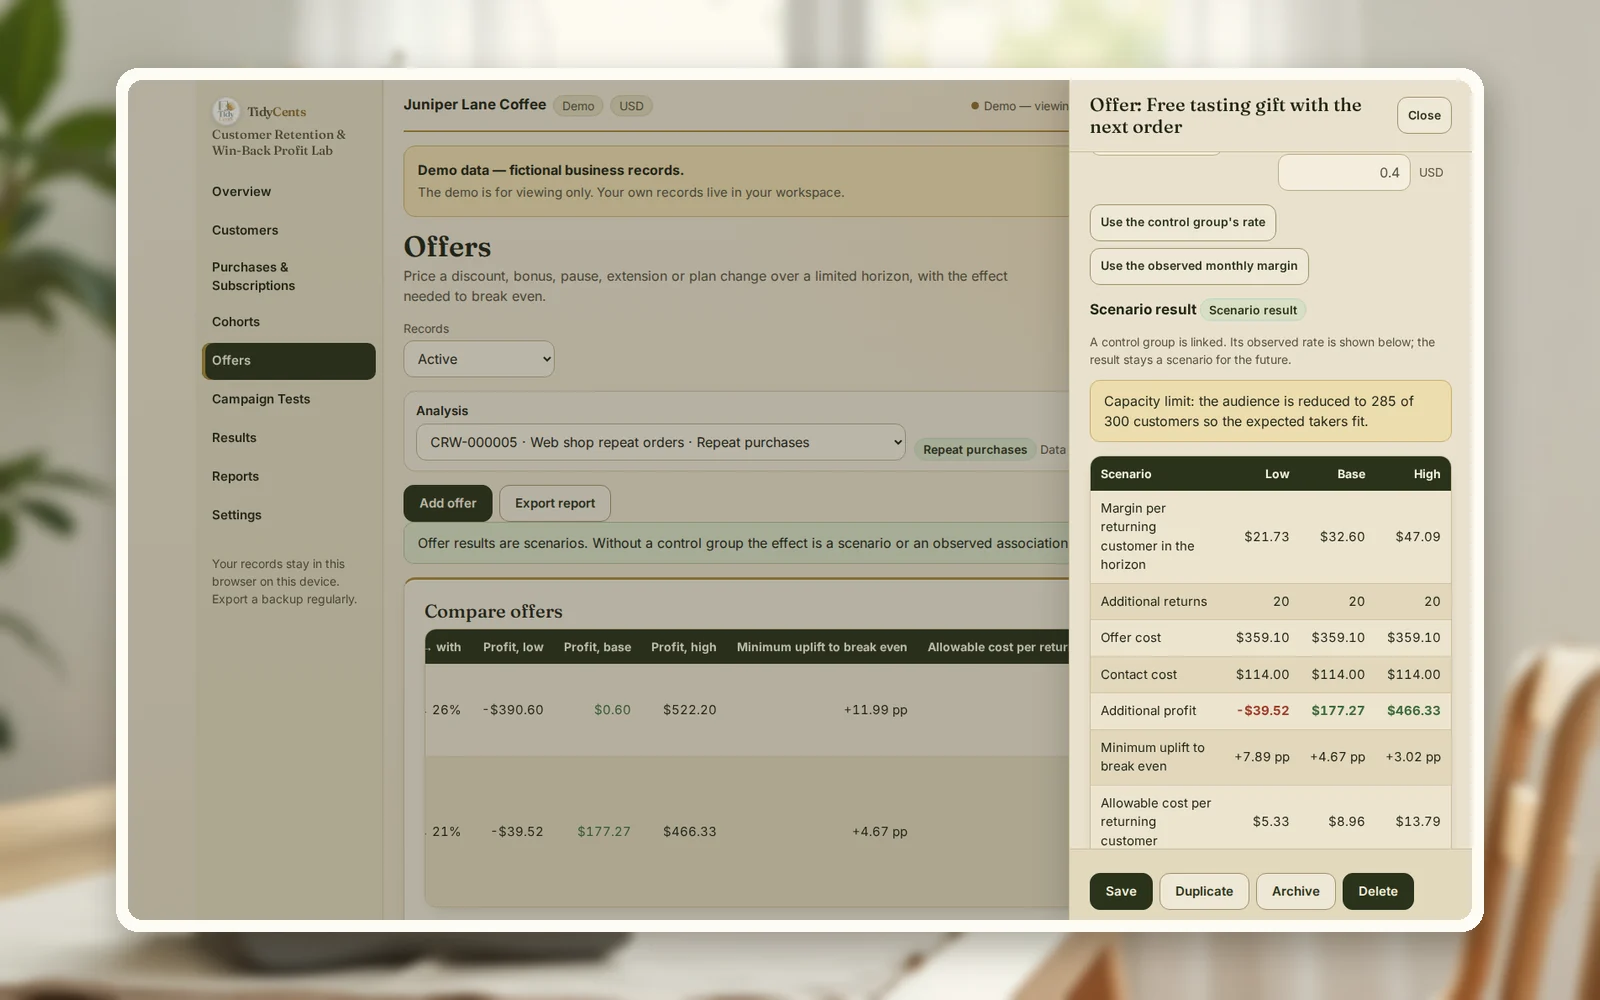
A win-back offer is worth it only if the customers it brings back who would not have returned anyway earn more over your planning horizon than the cost of the offer for everyone who uses it — including the people who were coming back regardless. That last group is where most discounts leak: in the example below, 42 of the 78 customers who use a 20% discount would have ordered anyway, and the offer ends up making $0.60 on 300 customers. A cheaper free gift makes $177.27 on the same group.
Why "customers recovered" is the wrong scoreboard
Win-back reports usually count how many lapsed customers ordered after the email. That number mixes three groups:
- People the offer really brought back — they alone create extra profit.
- People who would have ordered anyway — they still use the discount, so it costs you money.
- People who order once and leave again — their value depends on how long they stay, not on one order.
So the question is not "how many came back?" but "how many extra came back, what are they worth over the next months, and what did the offer cost on every redemption?"
The formula
For an audience of N lapsed customers:
- p₀ = share who would return without the offer (from a control group or your history).
- p₁ = share who return with the offer.
- Value per returning customer (M_H) = monthly margin, kept for as long as customers stay, over your horizon, discounted.
- Offer cost per taker (K) = discount + gift + extra service per customer who uses the offer.
- Profit = N × (p₁ − p₀) × M_H − N × p₁ × K − N × contact cost.
- Break-even uplift = (p₀ × K + contact cost) ÷ (M_H − K): the smallest extra return rate that pays.
A worked example
The numbers come from the demo of the Customer Retention & Win-Back Profit Lab: a fictional coffee roaster with 300 web-shop customers who have not ordered for 120+ days. Without any offer, about 14% of them order again within the campaign window. A returning customer is worth $32.60 of margin over the next 6 months (about $9 a month, with 80% staying each month). Each contact costs $0.40.
| Offer | Return rate with offer | Extra customers | Cost of the offer | Profit over 6 months |
|---|---|---|---|---|
| 20% off the next order ($13.50 per order) | 26% | 36 | $1,053 for 78 takers | $0.60 |
| Free tasting gift ($6, max 60 gifts) | 21% | 19.95 | $359.10 for 59.85 takers | $177.27 |
The discount brings back more people — 36 extra customers against about 20 — but it pays $13.50 to every one of the 78 who use it, including 42 who would have ordered anyway. That is $567 given to customers who did not need a reason. The result is a campaign that breaks even almost exactly: it needs at least 11.99 extra percentage points to pay, and it is assumed to deliver 12.
The gift is smaller, cheaper and capped at 60, so the lab reduces the audience to 285 to stay within the gift stock. It needs only 4.67 extra points to pay and is expected to make $177.27.
The margin matters as much as the response. If a returning customer is worth only $6 a month, the 20% discount loses $390.60; at $13 a month, it makes $522.20. That is why the lab shows a low, base and high case rather than one figure.
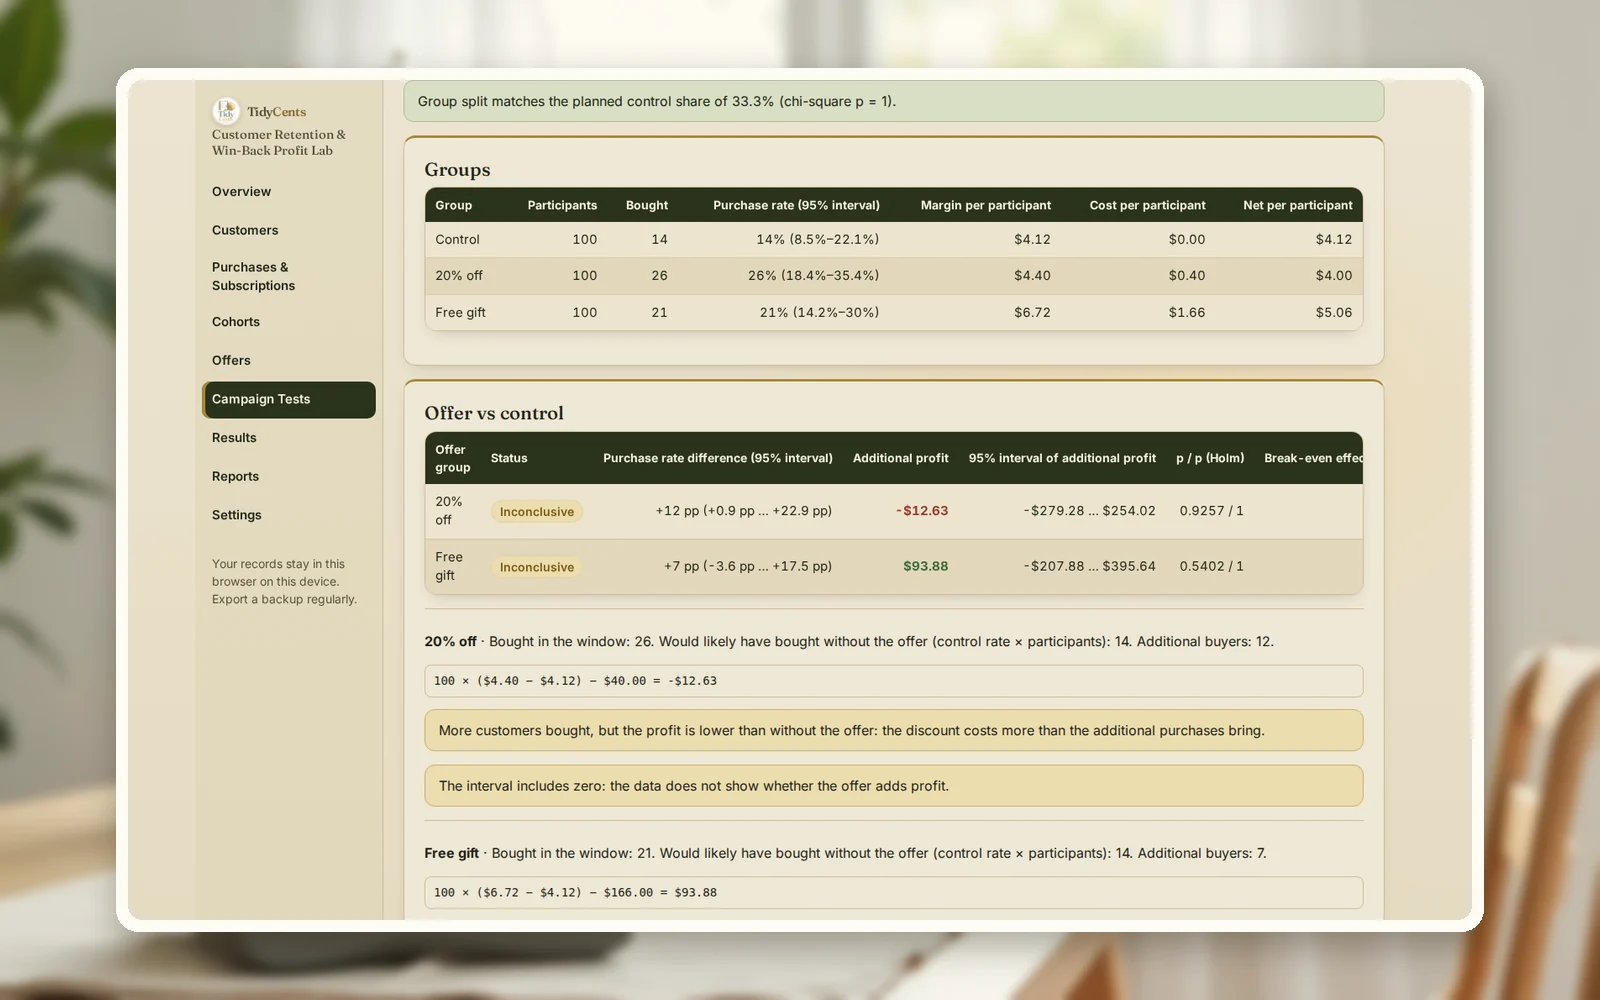
What the real test said. In June the roaster ran both offers with a third of the audience held out as a control group. Both results came back inconclusive: the discount −$12.63 (range −$279.28 to $254.02), the gift $93.88 (range −$207.88 to $395.64). With groups this size, neither can be called a win yet — an honest answer that keeps the roaster from scaling a discount that may not pay.
For subscriptions the same maths says something different: offering a one-month pause to 40 subscribers who asked to cancel is expected to make $591.48, because it costs little and keeps customers worth $61.25 each over the horizon.
Step by step: test a win-back offer
- Define "lapsed" — for example, no order for 120 days — and list the customers.
- Find the base return rate from history or, better, from a control group that gets no offer.
- Estimate what a returning customer is worth over a limited horizon, with a low and a high case.
- Price the offer per taker: discount, gift, extra service, and the contact cost per person.
- Compute profit and the break-even uplift. If the uplift you need is larger than you can realistically expect, change the offer before sending it.
- Send it with a control group that is not contacted, and compare margin per person.
- Scale only when the result is positive and not just inside the noise.
Common mistakes
- Counting every returning customer as recovered. Some were coming back anyway.
- Forgetting the discount on those customers. It is a pure cost.
- Valuing a customer by one order. Use the margin over the months they are likely to stay.
- Ignoring stock or capacity limits. A gift you can only give 60 times caps the campaign.
- Running without a control group. Then you cannot separate the offer's effect from normal returns.
- Scaling an inconclusive test. A range that crosses zero means "not proven yet".
When a tool helps
The formula fits on paper; the inputs do not. The Customer Retention & Win-Back Profit Lab keeps customers, purchases, refunds and subscription changes as history, builds cohorts, prices offers over a limited horizon with the break-even effect, and measures campaigns against a control group with the uncertainty shown. Exact decimal arithmetic, no AI guesses. To see how much a single big customer weighs on your revenue, try the free customer concentration calculator.
Open the demo with the coffee roaster above — every screen, no sign-up — then load your own customers and offers.
Open the Customer Retention & Win-Back Profit LabAll cost, pricing and profit tools
Related guides: are my ads profitable, how to track class packages and how much revenue from one client is too much.
FAQ
How much discount should a win-back offer give?
The largest you can afford is the allowable cost per taker: ((p₁ − p₀) × M_H − contact cost) ÷ p₁. In the example it is $13.50 for the discount — exactly what the discount costs, which is why it barely breaks even — and $8.96 for the gift, which costs $6.
Is a free gift better than a discount?
Not always, but a gift often costs less per taker than a percentage off, and it can be capped. Compare both with the same formula and, if possible, the same control group.
How long a horizon should I use?
As long as you can honestly predict customers staying — often 3 to 12 months for a small shop. Longer horizons make every offer look better; show a low case too.
Why do I need a control group?
Because some lapsed customers return on their own. Without a group that gets nothing, you will credit the offer with their orders and overpay for every future campaign.
What about subscriptions?
Use the same idea with monthly revenue: a pause or downgrade offer is worth the margin of subscribers who stay because of it, minus its cost. Net and gross revenue retention show whether existing subscribers grow or shrink over time.
This is decision support, not financial or marketing advice.
Tools mentioned in this guide
 Interactive tool
Customer Retention & Win-Back Profit Lab
Compare customer retention and win-back offers by the profit they add—not just the customers they bring back.

