
Cost of poor quality: which defects cost the most?
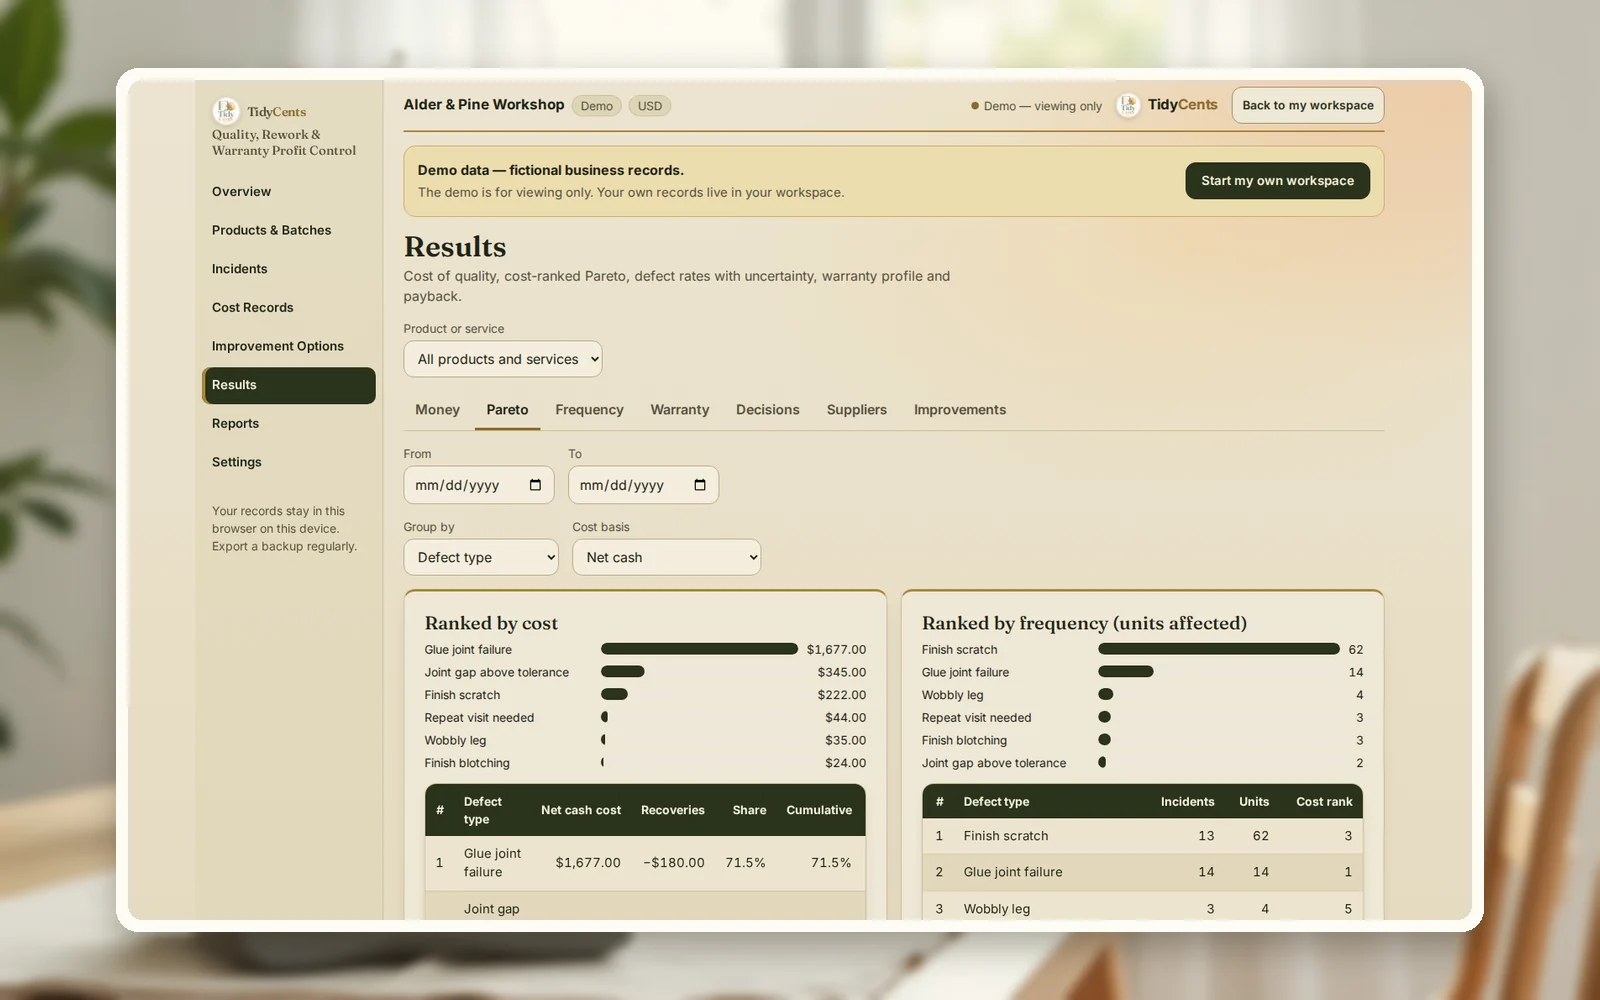
The cost of poor quality is everything you spend because something was not right the first time: rework labour and materials, scrap, replacements, return shipping, warranty repairs and refunds, minus anything you recover from a supplier. Rank defects by that cost, not by how often they happen — the most frequent defect is often cheap, and a rare one can eat most of the money. Then judge each fix by net yearly saving and payback: in the example below, one fix pays back in under two years and another loses $2,521.89 a year.
Why counting defects is not enough
A defect log tells you what happens most often. It does not tell you where the money goes. Three things distort the picture:
- Frequency is not cost. Fifty small scratches touched up in ten minutes each can cost less than one failed joint that needs a collection, a new part and a courier.
- Cash and time get mixed. Paid invoices, your team's hours and "lost sales" are different kinds of cost; adding them into one number hides which one you can actually save.
- Double counting. The same replacement part can appear on the incident, on the supplier credit and in the warranty log.
A fix should then be judged like any investment: what it costs now, what it costs every year, and how much failure cost it really removes.
The formula
- Failure cost per defect type = cash spent on rework, scrap, replacements, shipping and refunds − recoveries from suppliers. Internal time is shown beside it, not added.
- Defect rate = defective units ÷ units produced.
- Avoided failures per year = yearly volume × (rate before − rate after).
- Gross yearly saving = avoided failures × cost per failure.
- Net yearly saving = gross saving − recurring cost of the fix.
- Payback (years) = one-off cost ÷ net yearly saving — only when the net saving is positive.
A worked example
The numbers are the demo of Quality, Rework & Warranty Profit Control: a fictional furniture workshop making oak side tables and walnut chairs. Over 1,790 units it recorded 35 incidents. Ranked two ways, they tell different stories:
| Defect | Units affected | Defect rate | Net cash cost | Share of cash cost |
|---|---|---|---|---|
| Glue joint failure | 14 | 0.78% | $1,677 | 71.5% |
| Joint gap above tolerance | 2 | 0.11% | $345 | 14.7% |
| Finish scratch | 62 | 3.46% | $222 | 9.5% |
| Repeat visit needed | 3 | 0.17% | $44 | 1.9% |
| Wobbly leg | 4 | 0.22% | $35 | 1.5% |
| Finish blotching | 3 | 0.17% | $24 | 1.0% |
By frequency, scratches are the problem — 62 units. By money, glue joints are: 14 failures cost $1,677 in cash, after $180 recovered from a supplier, plus $532 of internal time kept in a separate column. Total cash cost of poor quality: $2,347.
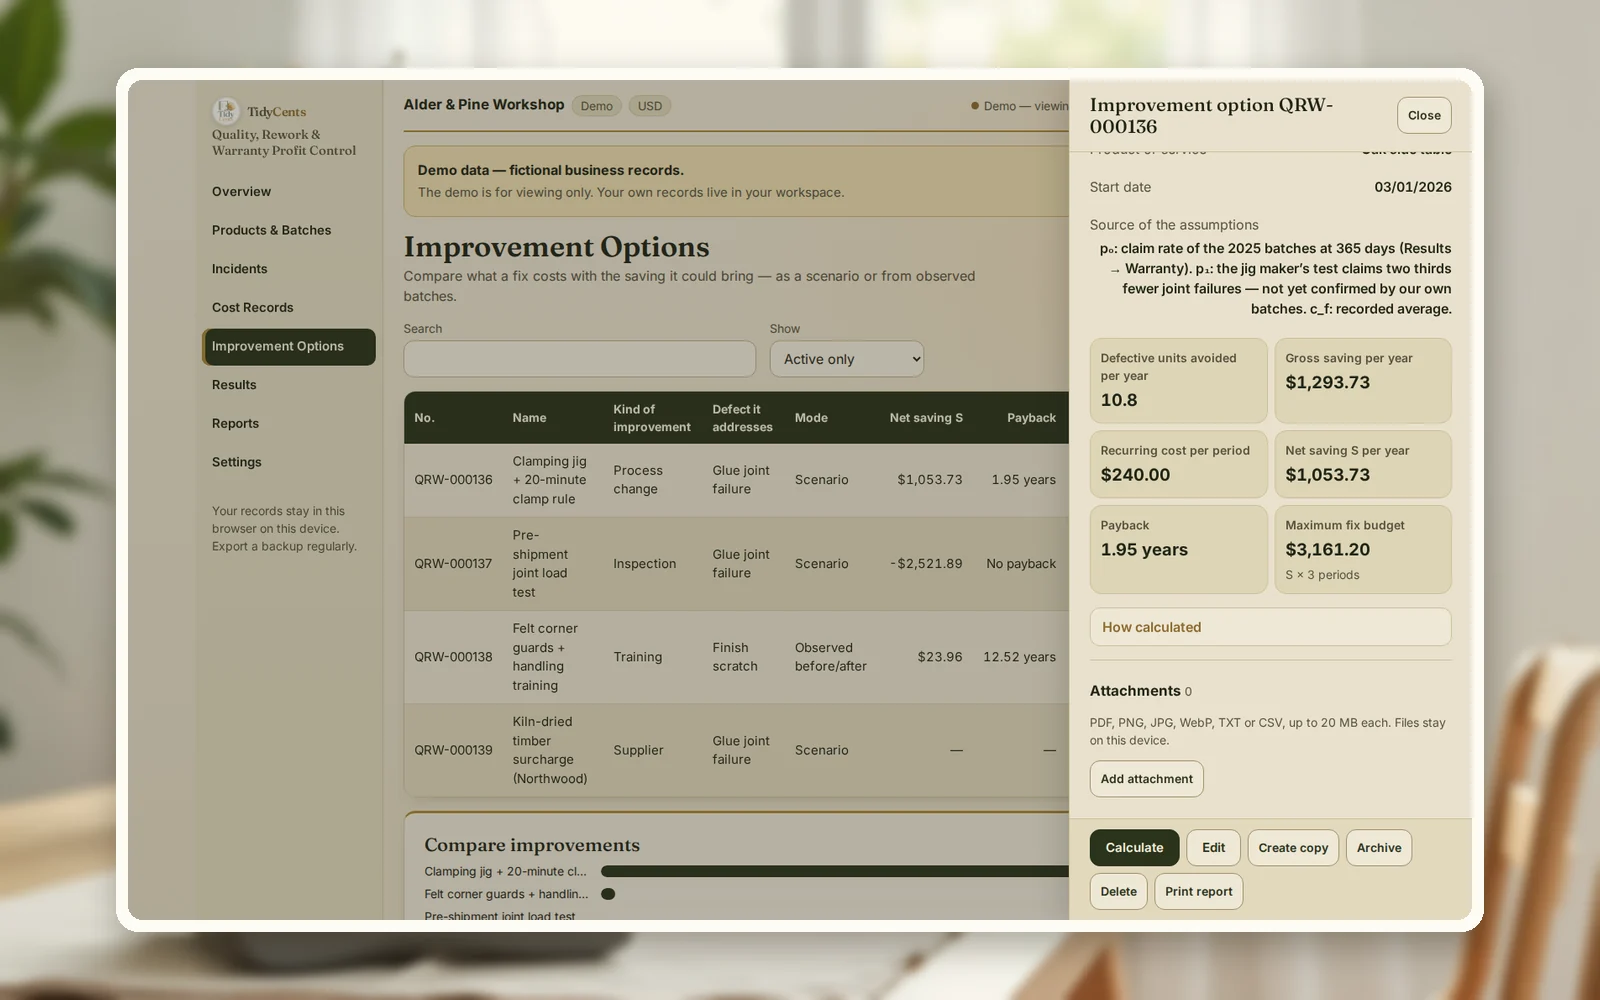
Now the fixes for glue joints, at 1,800 tables a year and an average $119.79 per failure:
| Fix | One-off cost | Yearly cost | Failure rate before → after | Net yearly saving | Payback |
|---|---|---|---|---|---|
| Clamping jig + 20-minute clamp rule | $2,050 | $240 | 0.9% → 0.3% | $1,053.73 | 1.95 years |
| Pre-shipment joint load test | $900 | $3,600 | 0.9% → 0.4% | −$2,521.89 | never |
The jig avoids about 10.8 failures a year, worth $1,293.73, and pays back in just under two years. The load test catches failures too, but its running cost is more than three times what it saves. Over a three-year horizon the jig would still be worth it up to $3,161.20 of one-off cost — a useful ceiling when you negotiate its price.
One honest caveat: the "after" rate for the jig is the maker's test result, not yet the workshop's own data, so the lab labels it a scenario, not a measured result. For scratches, felt corner guards were tried: the rate fell from 5.0% to 2.8% in the batches since, but the confidence interval still includes zero, so the lab marks the improvement uncertain rather than proven.
Step by step: find the defects that cost the most
- Log every incident with the defect type, units affected, batch and whether it was caught inside or by a customer.
- Attach the costs to each incident — materials, labour, shipping, refunds — and record supplier recoveries.
- Keep cash, internal time and lost-sales estimates in separate columns. Decide later which ones count.
- Rank defect types by net cash cost and compare with the ranking by frequency.
- Price each fix: one-off cost, yearly cost and the failure rate you expect after it.
- Compute net yearly saving and payback. Reject fixes whose running cost exceeds what they save.
- Check the result later against the batches made after the change.
Common mistakes
- Fixing the most frequent defect first. It is often the cheapest.
- Adding time and cash into one number. Saved hours only save money if you use or cut them.
- Counting a replacement twice. One source, one cost.
- Ignoring supplier recoveries. They reduce what the defect really costs you.
- Trusting a vendor's improvement claim as data. Treat it as a scenario until your own batches confirm it.
- Judging a fix without its running cost. An inspection that costs more each year than it saves is a loss.
When a tool helps
A spreadsheet can hold a defect list. Keeping costs attached to incidents and batches, preventing double counts, comparing warranty claims at the same batch age and testing fixes with honest statuses is harder. Quality, Rework & Warranty Profit Control ranks defects by cost and by frequency side by side, keeps cash, time and opportunity estimates apart, computes payback for each fix and marks uncertain results as uncertain. Exact decimal arithmetic, no AI guesses. To see what a cost increase does to your price floor, try the free minimum price calculator.
Open the demo with the furniture workshop above — every screen, no sign-up — then log your own incidents and costs.
Open Quality, Rework & Warranty Profit ControlAll cost, pricing and profit tools
Related guides: how to calculate landed cost, the true cost of a return and why the same business problems keep coming back.
FAQ
What is included in the cost of poor quality?
Internal failure (rework, scrap, re-inspection), external failure (returns, warranty repairs, replacements, refunds, extra shipping) and, if you choose, the time your team spends on them. Prevention and inspection costs are usually tracked alongside, because a fix moves money from failure into prevention.
How do I calculate rework cost?
Add the materials, labour at your internal hourly cost and any extra shipping for each reworked unit, then subtract what a supplier refunds. Keep labour you pay anyway in a separate column if you want to see the cash effect alone.
How do I know if a quality fix is worth it?
Estimate how many failures it avoids per year, multiply by the cost per failure, subtract the fix's yearly running cost, and divide the one-off cost by what remains. If the net saving is negative, the fix loses money however good it sounds.
What if my "after" data is small?
Then the result is uncertain, and that is worth knowing. Compare defect rates with confidence intervals; if they overlap zero, keep measuring before you scale the fix.
Should warranty claims be compared by calendar date?
Compare batches at the same age — for example, claims within 365 days of release. Older batches have simply had more time to fail.
This is decision support, not financial or legal advice.
Tools mentioned in this guide
 Interactive tool
Quality, Rework & Warranty Profit Control
Find the defects and warranty problems costing the most, then compare the financial return from fixing them.

