Food truck break-even — how many servings a day?
A food truck breaks even for the day when the gross profit from what it sold covers that day's share of fixed costs: break-even servings per day = (monthly fixed costs ÷ trading days) ÷ average gross profit per serving. With $4,200 of monthly fixed costs, 20 trading days and an average of about $3.05 gross profit per serving, the truck needs 69 servings before the day earns anything. Revenue targets hide this: a $500 day can be profitable or a loss, depending on what was sold.
Why a revenue target is not enough
"We need $600 a day" is a common rule. It breaks down because:
- Items earn very different amounts. A burger can leave several times the gross profit of a taco or a drink.
- Food cost is higher than it looks. Beef shrinks on the flat-top, produce is trimmed and peeled. You pay for the raw weight and sell the cooked portion.
- Packaging counts. A tray, napkin and fork go out with almost every serving.
- Fixed costs do not care how busy you were. Truck payment, insurance, commissary, permits and phone run every month.
A servings target built from gross profit tells you what each day really has to do.
The formula
- Cost per usable unit of each ingredient = pack price ÷ (pack size × usable %). An 80/20 patty losing about 12% on the griddle: raw beef at $5.50 per lb costs $5.50 ÷ 0.88 = $6.25 per cooked lb.
- Cost per item = ingredients + packaging + prep and serve labour + overhead share.
- Gross profit per item = price − cost per item.
- Average gross profit per serving = total gross profit ÷ servings sold.
- Daily fixed cost = monthly fixed costs ÷ trading days.
- Break-even servings per day = daily fixed cost ÷ average gross profit per serving, rounded up.
A worked example
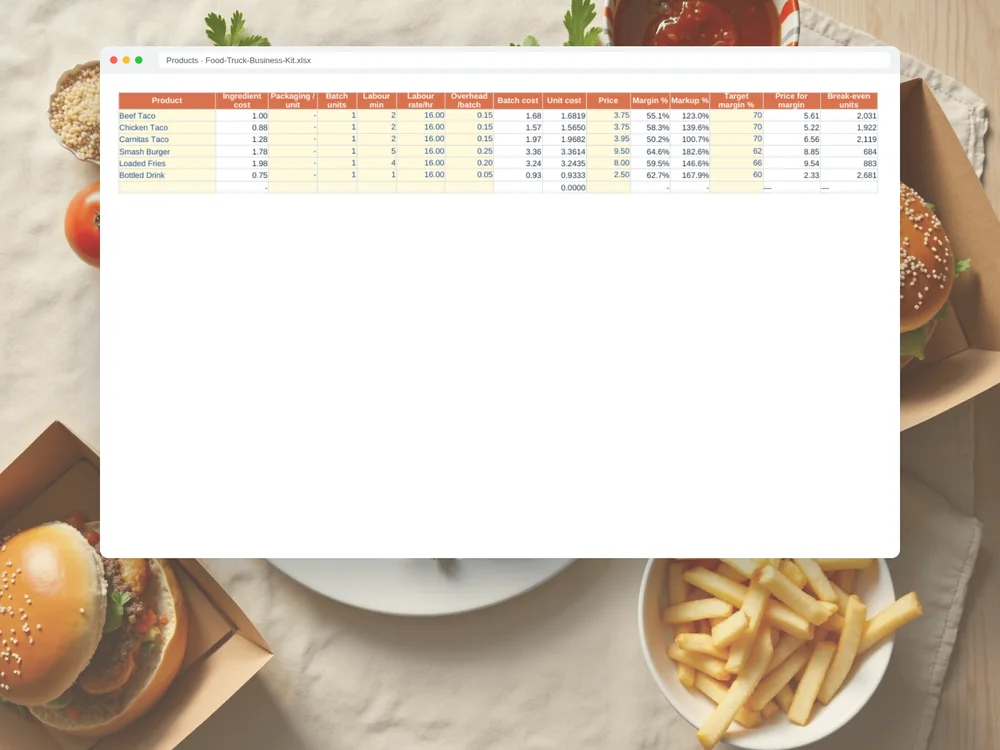
Costs per item come from the sample taco-and-burger truck in the Food Truck Business Kit, rounded to cents:
| Item | Price | Cost per item | Gross profit |
|---|---|---|---|
| Beef taco | $3.75 | $1.68 | $2.07 |
| Smash burger | $9.50 | $3.36 | $6.14 |
| Loaded fries | $8.00 | $3.24 | $4.76 |
| Bottled drink | $2.50 | $0.93 | $1.57 |
A typical lunch sells 60 tacos, 25 burgers, 15 fries and 30 drinks = 130 servings:
- Gross profit = 60 × $2.07 + 25 × $6.14 + 15 × $4.76 + 30 × $1.57 = $124.20 + $153.50 + $71.40 + $47.10 = $396.20
- Average gross profit per serving = $396.20 ÷ 130 = $3.05
- Daily fixed cost = $4,200 ÷ 20 trading days = $210
- Break-even = $210 ÷ $3.0477 = 68.9 → 69 servings
Check: 69 × $3.0477 = $210.29 covers the day; 68 × $3.0477 = $207.24 does not. On this 130-serving day the truck earns $396.20 − $210 = $186.20 above its fixed costs, before tax.
Now change the mix: sell 10 more burgers and 10 fewer tacos. Gross profit rises by 10 × ($6.14 − $2.07) = $40.70 with the same number of servings. That is why the average gross profit per serving — and therefore break-even — comes from your own sales, not from a rule of thumb.
Which pitch actually pays?
The same logic compares locations. Three fictional bookings, each total from the sales log:
| Pitch | Revenue | Gross profit | Margin |
|---|---|---|---|
| Downtown lunch lot (1 day) | $560 | $300 | 53.6% |
| Brewery Friday (1 evening) | $1,040 | $560 | 53.8% |
| Weekend festival (2 days) | $2,400 | $1,150 | 47.9% |
The festival has the biggest revenue, but if it charges a $600 pitch fee, what remains is $1,150 − $600 = $550 for two days — $275 a day, against $560 for one brewery evening. Book on gross profit after fees, not on crowds.
How to do it in the kit
The Food Truck Business Kit is one Excel and Google Sheets file:
- On Start Here, set your currency, monthly fixed costs, tax set-aside % and trading days per month.
- On Ingredients, list proteins, produce, buns, sauces, oil, drinks and packaging with pack price, pack size and usable % after trim and cook-loss.
- On Recipes and Products, build each item and add labour and overhead: cost per item, margin and markup, the price for a target margin and break-even units.
- On Sales, log each line with its event or location. The Dashboard shows break-even covers per day and profit by event or location side by side.
- Freshness / Par flags each perishable OK, USE SOON or EXPIRED and shows how much to top up to par; the stock room flags what to reorder.
Any currency, no macros, nothing locked.
Related guide: actual vs theoretical food cost.
Know how many servings each day has to clear — from your own menu and sales.
FAQ
What is a "cover" on a food truck?
One serving sold. Counting servings rather than customers keeps the target simple: a customer who buys a burger and a drink is two servings with two different gross profits.
Which fixed costs should I include?
Everything you pay regardless of sales: truck or trailer payments, insurance, commissary rent, permits and licences, phone and card-reader fees that are fixed, and your own salary if you pay yourself a fixed amount.
Does the break-even change with the season?
Yes. Fewer trading days in winter raise the daily fixed cost, and a different menu changes the average gross profit per serving. Recalculate when either changes.
How do I account for cook-loss and trim?
Give each ingredient a usable %. The cost of the edible portion is the raw cost divided by that %, so a 12% griddle loss makes beef cost about 14% more per cooked pound than per raw pound.
Should event fees be part of break-even?
A pitch or festival fee belongs to that booking. Subtract it from that event's gross profit before comparing it with your regular locations.
This is decision support, not financial, tax or food-safety advice.