What stocktake variance is acceptable — and how to calculate it

Stocktake variance is counted quantity − expected quantity, valued at unit cost. The expected quantity is not the figure in your system at the start of the count: it is that snapshot plus or minus every sale, delivery and transfer that happened before the shelf was counted. There is no universal "acceptable" percentage. Set a recount tolerance per item (tighter for expensive, fast-moving lines), investigate every line outside it, and judge the overall result against shrink as a percentage of sales — US retailers reported an average of 1.6% for FY 2022 in the NRF National Retail Security Survey. Above all, report shortages and surpluses separately: a small net result can hide two large errors.
How do you calculate stocktake variance?
Four formulas cover almost every stock count:
- Expected quantity = snapshot quantity − units out (sales, transfers out) + units in (deliveries, returns, transfers in), counting the movements booked between the snapshot and the moment that line was counted.
- Variance in units = counted − expected. Negative is a shortage, positive a surplus.
- Variance value = variance in units × unit cost.
- Variance % = variance in units ÷ expected × 100, per line.
For the period as a whole, the inventory shrinkage formula most retailers use is: confirmed shortage value ÷ sales for the period × 100. Measure shortage and sales on the same basis (both at cost or both at retail), or the percentage means nothing.
A worked example: 100 bottles, 8 moved out during the count
A shop takes its stock snapshot at 8 a.m.: 100 bottles of olive oil at $7.50 each. The shop stays open, and 8 bottles go out (sold or moved) before the shelf is counted. The first count says 99, which is flagged and recounted; the recount finds 89.
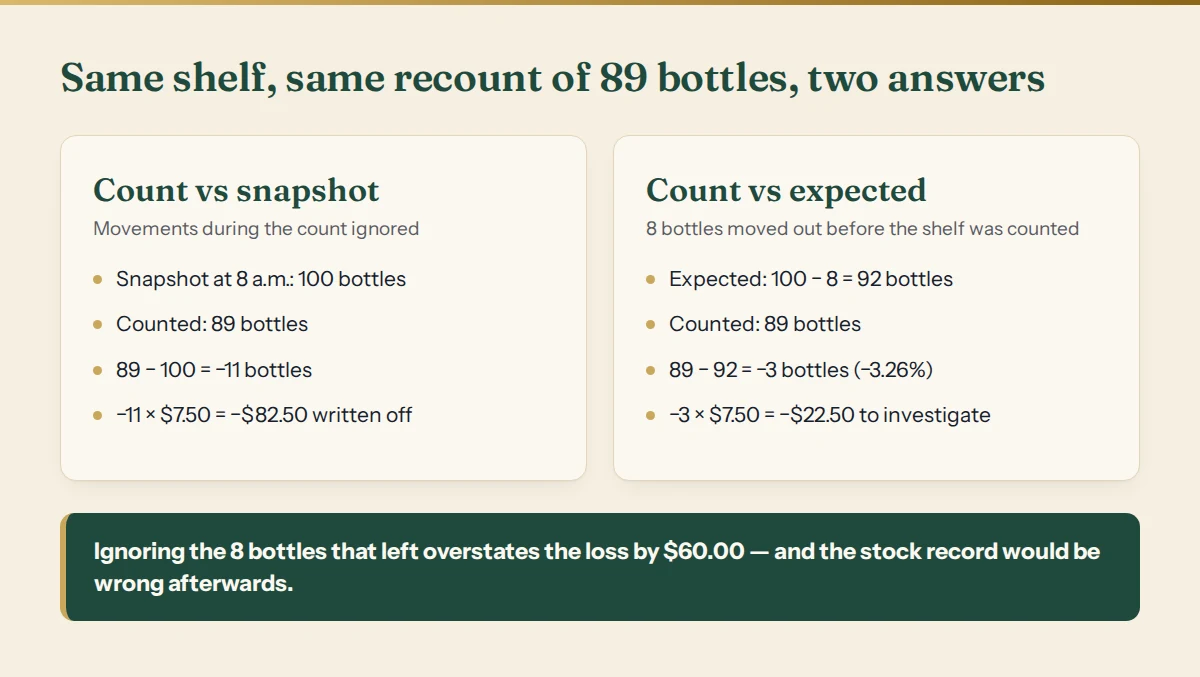
- Expected: 100 − 8 = 92 bottles.
- Variance: 89 − 92 = −3 bottles, or −3.26% of expected.
- Value: −3 × $7.50 = −$22.50.
Compare the count with the snapshot instead and you get 89 − 100 = −11 bottles, −11 × $7.50 = −$82.50. That overstates the loss by $60.00, and if you then overwrite stock with 89 "because that is what is there", those 8 bottles are effectively taken off twice. The adjustment to post is −3 bottles: current stock goes from 92 to 89.
Why is a stock difference not automatically a loss?
A negative line means "we cannot account for these units yet", not "these units were stolen". Common explanations, roughly in the order worth checking:
- Movements during the count. Sales, deliveries or transfers between the snapshot and the count, or entered late, after the count.
- Unit-of-measure errors. A case of 12 counted as 1, or 6 loose bottles entered as 6 cases.
- Wrong location. Stock sitting in the back room, in a van or on another shelf, counted elsewhere or not at all.
- Missing documents. A delivery received but never entered makes a surplus; a return to the supplier never entered makes a shortage.
- Counting errors. Skipped shelves, double-counted bays, a miscount on a high pile.
The NRF survey is a useful reminder that not all shrink is theft: retailers attributed 36% of shrink to external theft, 29% to employee theft and 27% to process and control failures and errors, with the rest unknown or other (NRF National Retail Security Survey 2023, PDF). Fix the process causes and the "loss" often shrinks on its own.
What is an acceptable stocktake variance percentage?
The benchmark most often quoted comes from the NRF: the average shrink rate was 1.6% of sales in FY 2022, up from 1.4% the year before, and shrink accounted for $112.1 billion in losses (NRF press release). On $500,000 of annual sales, 1.6% is $8,000; 1.4% is $7,000. Those are averages reported by the US retailers in the survey, not a target, and a shop with high-value items or few staff may need to do far better.
For an individual count, a single percentage is the wrong tool. Use two thresholds per item, and recount when either is exceeded:
- A quantity tolerance — for example "more than 2 units" for bottles, much tighter for phones or perfume.
- A percentage tolerance of the expected quantity, so a line with 240 units is not flagged for the same 2 units as a line with 12.
Then add one rule regardless of tolerance: anything found where zero was expected is checked, because it usually points to a missing document or the wrong location. Tolerance decides what to recount, not what to write off.
Why must shortages and surpluses be shown separately?
Because they do not cancel each other out in real life. Here are four lines from the same count:
| Item | Expected | Counted | Units | Unit cost | Value | % of expected |
|---|---|---|---|---|---|---|
| Olive oil 1 l | 92 | 89 | −3 | $7.50 | −$22.50 | −3.26% |
| Coffee beans 1 kg | 40 | 52 | +12 | $14.00 | +$168.00 | +30.00% |
| Rioja 75 cl | 60 | 42 | −18 | $9.00 | −$162.00 | −30.00% |
| Pasta 500 g | 240 | 236 | −4 | $1.20 | −$4.80 | −1.67% |
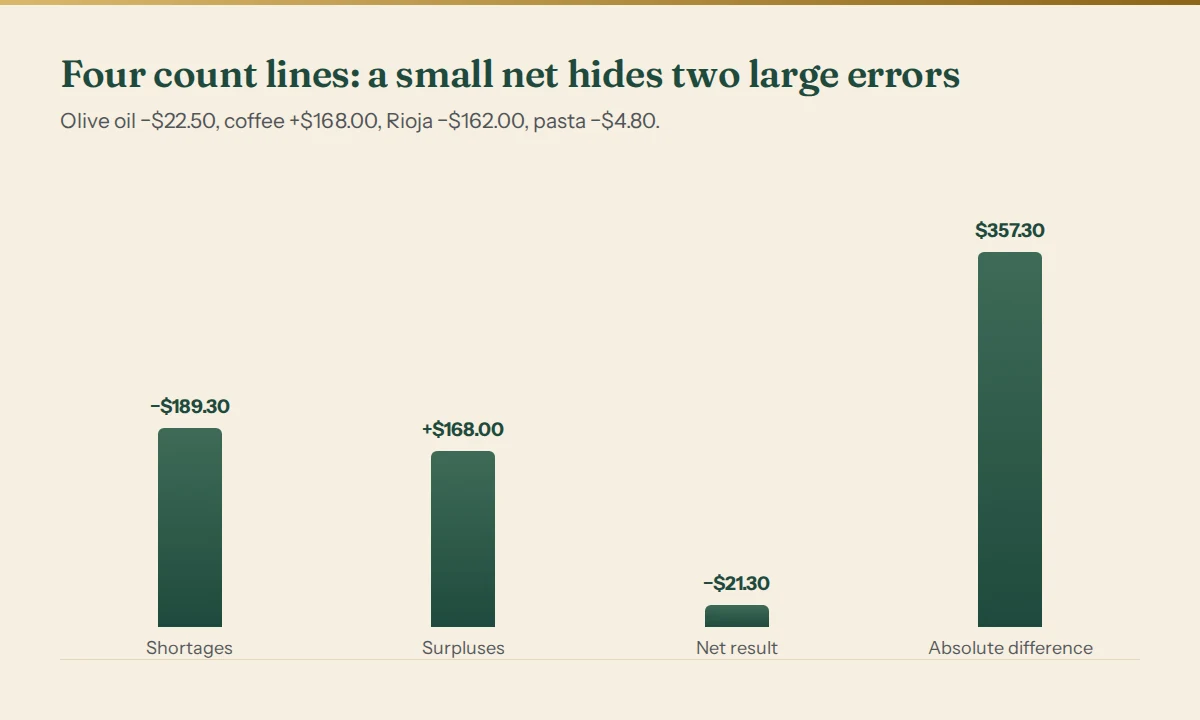
The net result is −$21.30, about 1.03% of the $2,078.00 of stock expected on these lines. It looks like a good count. But shortages total −$189.30 and surpluses +$168.00, an absolute difference of $357.30 — 17.19% of expected value. Two lines are each 30% out. In this case the coffee surplus was a delivery note never entered and the missing Rioja was a stack of cases in the back room. Once both are explained, what is left to investigate is −$27.30 (olive oil and pasta), and the stock record is right on all four lines. Net them off instead and both errors stay in the books until the next count.
A useful stocktake variance report therefore shows, per line and in total: expected, counted, units, value, percentage, cause, and separate totals for shortages, surpluses, net result and absolute difference.
How to run a count that gives honest numbers
- Take a timed snapshot of quantity and unit cost for every item and location.
- Decide whether movements stop. If the shop keeps trading, record the time of each count and the time of every movement.
- Count blind. Counters see the item and location, never the expected quantity, so they count what is there rather than confirm a number.
- Enter full packs and loose units separately, so the conversion to base units is done by a formula, not in someone's head.
- Recount lines outside tolerance, preferably by a different person. Keep every attempt; never average two counts.
- Find a cause for every remaining difference before approving it, and add any missing movement first.
- Post the adjustment, then compare shortage value with sales for the period.
Common mistakes in inventory variance analysis
- Comparing the count with the opening snapshot while the shop kept selling.
- Reporting the net figure alone, which lets a surplus hide a shortage.
- Averaging a count and a recount instead of choosing the one you trust.
- Writing everything off as theft before checking units, locations and paperwork.
- Overwriting stock with the count without recording the adjustment and its cause.
- Using one tolerance for everything, from pasta to perfume.
If you sell clothing or shoes, the same discipline applies at size and colour level: see boutique inventory by size and colour and shoe store inventory by size run.
Run your count with the tool
Stocktake & Shrinkage Control does exactly this: a timed snapshot, blind counts in packs and loose units, movements placed against each count, recounts that are never averaged, a required cause for every difference, and approved adjustments. The final statement shows expected, counted, difference, value and cause per line, with shortages and surpluses valued separately, and exports to CSV. Exact decimal arithmetic, no AI guesses. Open the free demo first; the tool is $24, one-time.
This is a counting and record-keeping method, not accounting, tax or legal advice.
Tools mentioned in this guide
 Interactive tool
Stocktake & Shrinkage Control
Count what is really there, account for stock movements and resolve differences before adjusting inventory.
 New
 New